Visualize the Parameters
When OpenDelta makes modifications to a pretrained model (PTM), it is beneficial to know what your PTM looks like, especially the location of the parameters.
Before applying opendelta, you can know how to specify your modifications in terms of key addressing.
After the modification is done, you can know if your modification is what you expected, for example, whether the position of the delta modules are desired, or whether you froze the correct parameters.
Now let’s begin to try the visualization utility.
Visualization is NOT easy using pytorch native function.
from transformers import BertForMaskedLM
backbone_model = BertForMaskedLM.from_pretrained("bert-base-uncased")
print(backbone_model)
Click to view output
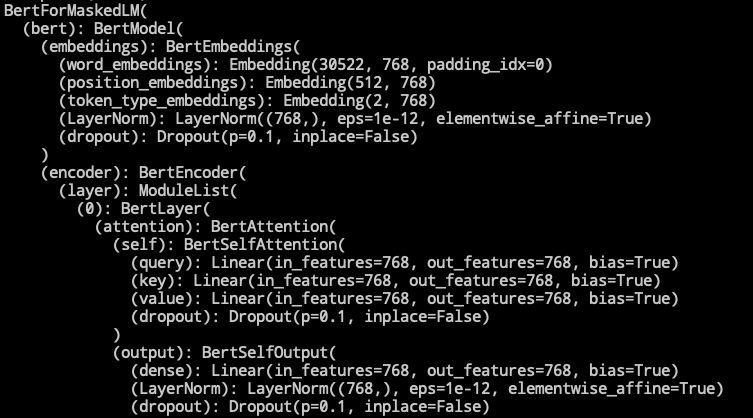
The original presentation of models is not tailored for repeated structures, big models, or parameters-centric tasks.
Using visualization from bigmodelvis.
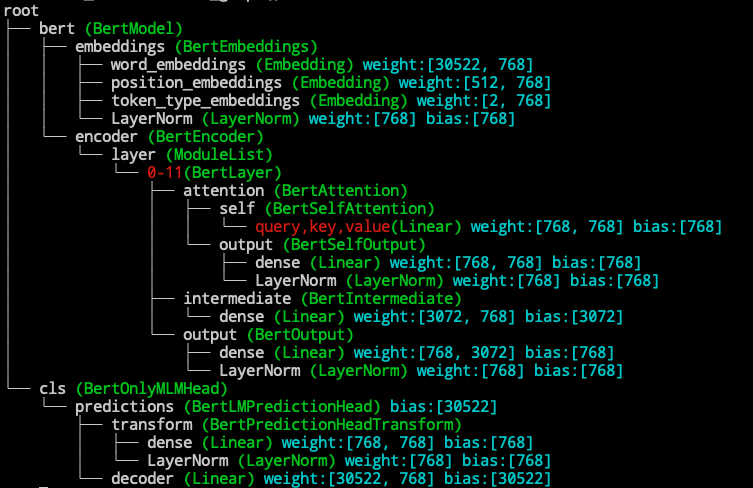
First let’s visualize all the parameters in the bert model. As we can see, structure inside a bert model, and the all the paramters location of the model are neatly represented in tree structure. (See color scheme for the colors)
from bigmodelvis import Visualization
model_vis = Visualization(backbone_model)
model_vis.structure_graph()
Suggestion
We can reference a module according to the graph easily:
print(backbone_model.bert.encoder.layer[0].intermdiate)
When using opendelta on a new backbone model, it’s better to first visualize the child module names (shown in white), and then designating the modified_modules.
Now add a delta model and visualize the change.
from opendelta import LowRankAdapterModel
delta_model = LowRankAdapterModel(backbone_model)
delta_model.freeze_module(exclude=["cls", "intermediate", "LayerNorm"])
Visualization(backbone_model).structure_graph()
Click to view output
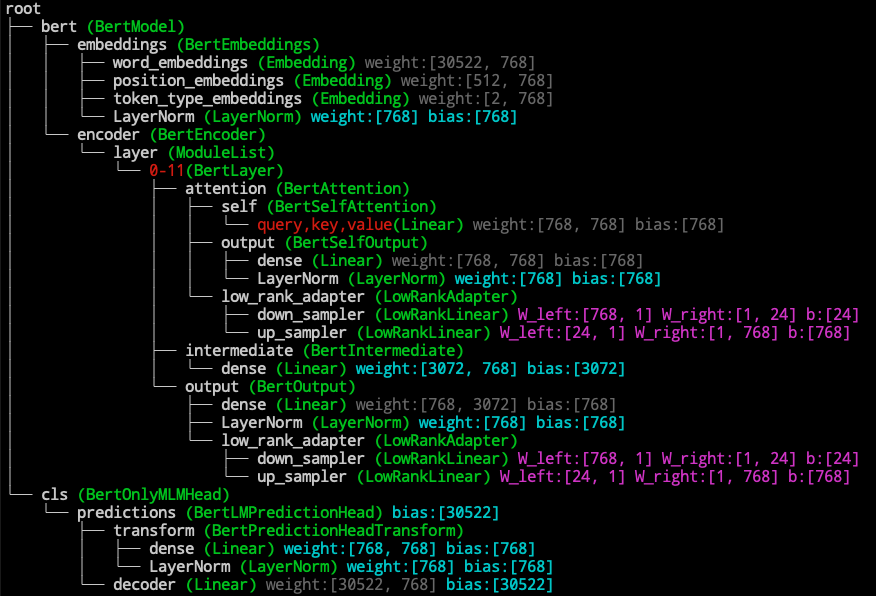
Color Schema
- The white part is the name of the module.
- The green part is the module's type.
- The blue part is the tunable parameters, i.e., the parameters that require grad computation.
- The grey part is the frozen parameters, i.e., the parameters that do not require grad computation.
- The red part is the structure that is repeated and thus folded.
- The purple part is the delta parameters inserted into the backbone model.
PlatForm Sentivity
Depending on the platform the code is running on, the colors may vary slightly.
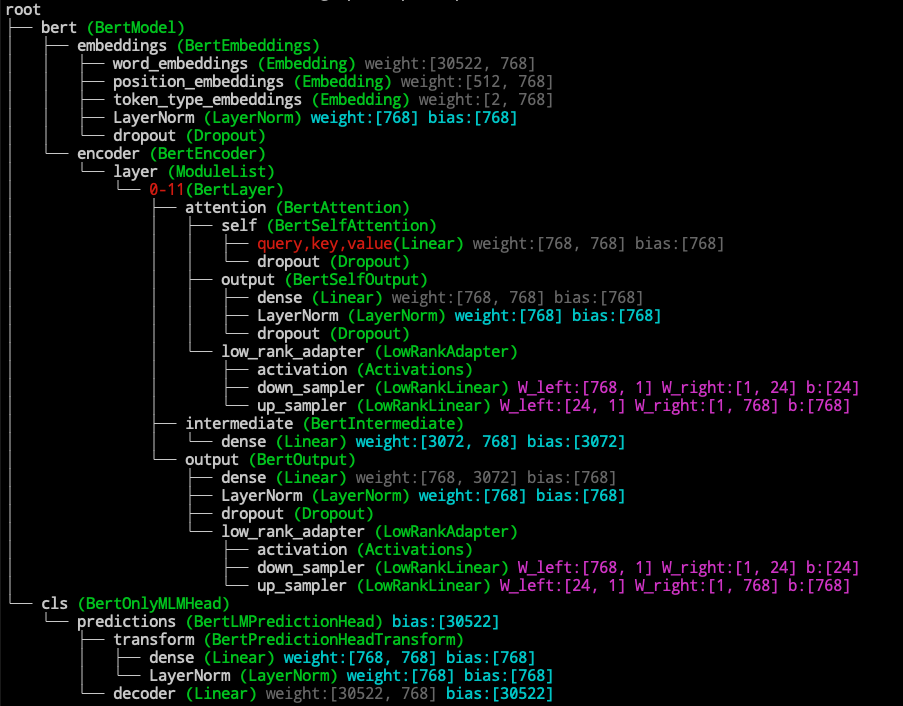
We also provide the option to visualize the nodes without parameters.
Visualization(backbone_model).structure_graph(keep_non_params=True)
Thus, the modules like dropout and activations are kept.
Click to view output
Order of the submodule
Currently, OpenDelta‘s Visualization visualize the model based on pytorch’s named_modules method. That means the order of the presented submodule is the order they are add to the parent module, not necessarily the order that tensors flows through.